Features
Serial Ports and Devices Monitoring
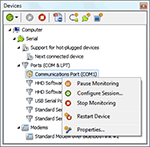
Free Serial Analyzer uses the special monitoring driver to let you monitor all serial devices connected to the computer either directly or via the external hubs. In addition, detailed information on device capabilities are displayed in Serial Device Information window.
You may also monitor the early device enumeration stages using product's unique "Next connected device" monitoring capability.
Restart any connected device or watch its properties using commands from the context menu.
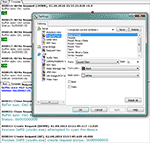
Displaying Monitored Packets in a Table
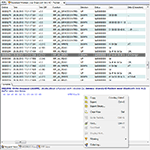
Packet View visualizer consists of two panes. Brief packet information is displayed in the upper pane. This includes packet capture time, packet type and size of the payload data. Lower pane displays the detailed information on a selected packet, using one of other supported data visualizers. That is, the same information is displayed, but only for a selected packet.
Visualizer contents may be copied into the Clipboard or exported in text or CSV format to an external file.
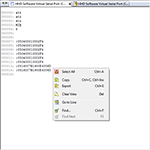
Displaying Monitored Packets in a Hex/ASCII View
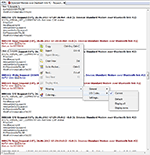
This visualizer displays the most detailed information about each monitored packet. Packet capture time, time span from the last monitored packet, packet type and other information are diplayed in the header, while packet payload is displayed below. In Basic mode, payload is hidden, in Complete mode it is always visible. You may change the mode for the whole visualizer or for an individual packet.
The contents of the visualizer can be copied into the Clipboard or exported into the file in various formats. Use the mouse to select the portion to copy/export or leave the selection empty to copy the entire visualizer contents.
Displaying Read/Written Data in Separate Windows
This visualizer displays incoming data in an upper pane and outgoing data in a lower pane. You may copy data into the Clipboard or export into text file.
Displaying Monitored Data in a Serial Console
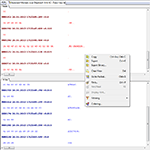
This visualizer is a useful tool for analysis of text-based protocol. It mimics the text console by displaying incoming and outgoing data as a single stream of text.
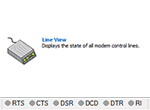
Displaying the Status of Serial (Modem) Control Lines
Provided the monitored application queries or controls the state of modem lines, this visualizer updates the states of standard serial line signals on the application status bar.
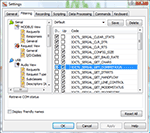
General Filtering Feature
Generic filtering function allows you to configure what packets are shown by visualizers. You may create a number of named schemes and switch between them at any time. You may even select different schemes for different visualizer windows.
Custom Color Schemes for Monitored Packets
Free Serial Analyzer allows you to change the appearance of visual elements for monitored packets in the following data visualizers:
- Request View (Serial, Bridge)
- Data View
- Console View
- Data View
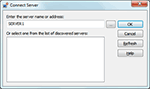
Remote Monitoring
Get Related Free Protocol Analyzers

Free USB Analyzer Monitor and Analyze USB Data Flows
Free Network Analyzer Monitor and Analyze Network Data Flows
Get Related Free Products

Free Virtual Serial Ports Create Virtual Serial Ports and Null-Modem Cables
Free Remote Serial Ports Access Remote Serial Ports using Network Connection
Free Serial Port Splitter Get access to serial device by multiple applications
Free Com Port Redirector Share and Access Serial Ports Over a TCP/IP network
Free Hex Editor View and Edit Binary Files in Just Seconds
Free Serial Port Terminal Run and automate serial port communication tasks
Free USB over Network Share & Access USB Devices over Network
DupeCare Deduplicate your folders automatically
Other Related Software Products
Device Monitoring Studío
View, log and analyze data coming through PC ports and connections View Details DownloadUSB Monitoring Control
View, analyze and process USB communication packets within your code View Details DownloadSerial Port Monitoring Control
View, analyze and process Serial communication data within your code View Details DownloadVirtual Serial Port Tools
Build virtual serial port configurations for your custom usage scenario View Details DownloadAutomated Serial Terminal
Communicate with serial devices & applications, automate workflow with scrips View Details DownloadOnline Serial Port Monitor
Use COM ports from your web browser: send, receive and monitor serial data online View DetailsFree Online Hex Editor Neo
Edit and analyze binary files directly in your web browser with just a few clicks View Details- Max session length: 20 minutes.
- Max sessions per day: 5.
- Windows 11
- Windows 10
- Windows 8.1
- Windows 8
- Windows 7
- Windows Vista
- Windows XP
- Windows Server 2025
- Windows Server 2022
- Windows Server 2019
- Windows Server 2016
- Windows Server 2012 R2
- Windows Server 2012
- Windows Server 2008 R2
- Windows Server 2008
- Windows Server 2003 R2
- Windows Server 2003
| Version | 10.10.00.2562 |
|---|---|
| Updated | |
| View Changes | |
| Interface | English |
| File format | application/octet-stream |
| Size (EXE) | 14.55 MB |
| Size (ZIP) | 27.81 MB |

